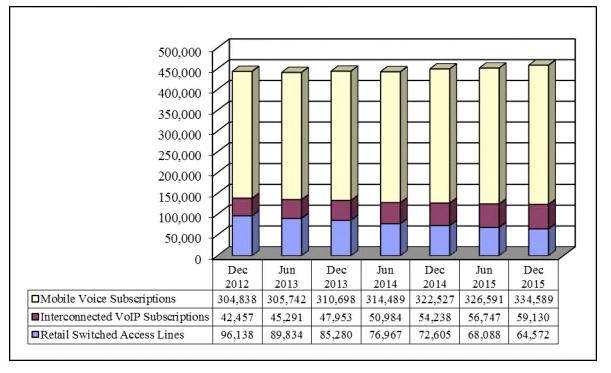
Stranded assets are a growing business model issue for large tier-one service providers. Consider that, between 2012 and 2015, U.S. fixed network switched voice connections dropped from 96 million to 64.6 million, a decline of 33 percent in just three years.
Of course, some additional lines were supplied by telcos, using voice over internet protocol platforms, so the extent of the voice services loss is less than appears, looking only at switched line loss.
The point is that nearly half of the total voice market now is supplied by attacking service providers, not telcos.
In other words, a fixed network built to serve “everyone” is used by about half of homes passed. That means the cost to serve each customer is twice as much as it used to be, as customers wind up paying for network investment that is stranded, and does not generate revenue.
Assume there are about 126 million U.S. households, about 98 percent of which are passed by a telco network. That implies some 123.5 million locations, of which perhaps 53 percent buy voice service.
That means the whole telco voice network derives revenue from about 65 million homes, or perhaps 52 percent of locations. And the problem seems to be getting worse, as consumers seem to be buying fewer telco fixed voice lines every year. For the market as a whole, that is offset by consumers buying cable TV fixed voice services, but even cable operators now are losing voice accounts.
For most of us, the idea that voice was a product like any other was unthinkable prior to the mid-1990s, for one simple reason: accounts and usage had risen steadily for more than a hundred years. And when use of primary lines seemed saturated, people started buying second lines. At first it might have been for use by teenagers in a household. Then demand for dial-up internet access happened. The point is that usage seemed only to move in one direction: up.
In the U.S. market, that cracked in either 2000 or 2001, depending on which data sources one looks at.
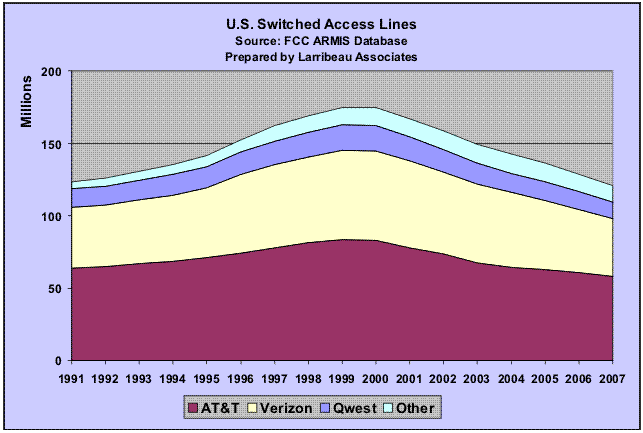
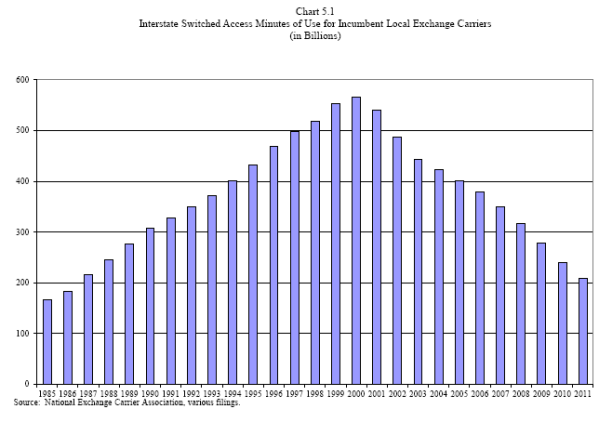
Global fixed access lines might have peaked about the same time. In the U.S. market, minutes of use peaked in 2000.
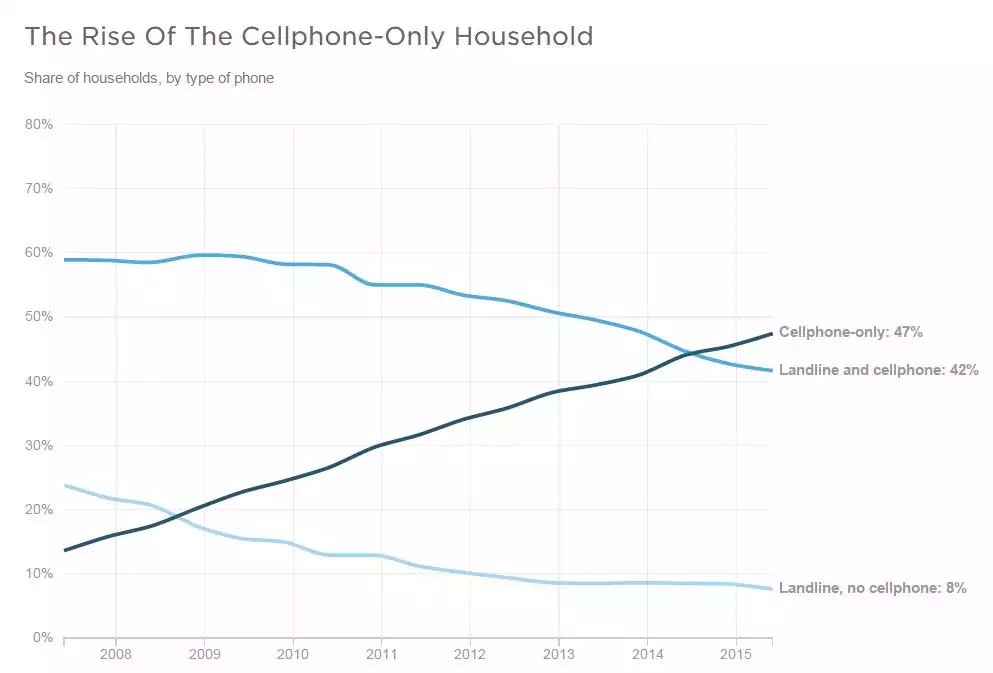
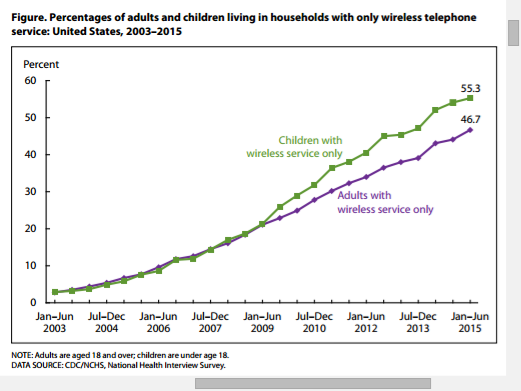
These days, nearly half of U.S. homes (47.4 percent) had only mobile phones during the first half of 2015. At the present rate of change, sometime in 2017 it is likely that at least half of all U.S. homes will not have a fixed line telephone service.
Also, more than 66 percent of all U.S. adults aged 25 to 34 and of adults renting their homes were living in mobile-only households.
Those are clear examples of product substitution and product lifecycles. People decided to use fixed telephony less, and mobile telephony more. Text messaging for a while was the big driver of incremental revenue in the mobile business, but that now has passed its peak, to be followed by mobile internet access as the growth driver.
Those are some of the changes we have seen over the past several decades.
Three Decades of Disruption
| |
1980
|
2015
|
Natural monopoly
|
Oligopoly
|
High margin
|
Moderate to low margin
|
Low to moderate adoption
|
High adoption
|
Low innovation
|
High innovation
|
Stable markets
|
Unstable markets
|
Compete on quality
|
Compete on price
|
Fixed network dominates
|
Mobile network dominates
|
Tightly integrated apps and network
|
Open network
|
Owned app creation
|
3rd-party app creation
|
Sell app, use network access
|
Sell network access (dumb pipe)
|
Voice business model
|
Internet access, mobile business model
|
Similar business models globally
|
Growing diversity of business models
|
99.999% uptime
|
99.9% or “good enough” availability
|
Few lead apps
|
Many lead apps
|
IT adoption: enterprise; SMB; consumer
|
IT adoption: consumer/SMB to enterprise
|


No comments:
Post a Comment